

Jul
14
2021
From The Blog
Tropical Storm Elsa Report
KICA takes the threats posed by tropical systems very seriously. KICA’s resilience specialist has prepared this report on the operational preparation, effects, and aftermath of the storm. On July 8, 2021, the eye of Tropical Storm Elsa made its way through the center of South Carolina between Columbia and Orangeburg. The large storm covered the majority of the state and was surrounded by bands of intense thunderstorms with wind gusts in excess of 50 mph recorded in multiple areas of Kiawah Island. The storm produced isolated thunderstorms and a few tornadoes on its path through South Carolina with the closest tornado touching down south of Kiawah on Edisto Island.
Preparing for the Storm
Before the event took place, KICA began storm preparation by coordinating between departments and communicating with island entities and state agencies to monitor the storm as it approached. The Lakes Department measured pond levels and assessed major outfall structures to ensure they were functioning properly. KICA’s ponds were 4-6 inches below their typical level since outfalls had been closed since June 22 for king tides. On Wednesday, KICA lowered five drainage basins, through one low tide cycle, to increase capacity (Egret, Pintail, Canvasback, Blue Heron, and pond 28).
During the Storm
On July 8, 2021, the eye of Tropical Storm Elsa made its way through the center of South Carolina between Columbia and Orangeburg. The large storm covered the majority of the state and was surrounded by bands of intense thunderstorms with wind gusts in excess of 50 mph recorded in multiple areas of Kiawah Island. The storm produced isolated thunderstorms and a few tornados on its path through South Carolina.
Kiawah Island began to feel the effects of Tropical Storm Elsa early Thursday morning at 12 a.m. At this time wind speeds on the island picked up and the island had already accumulated approximately an inch of rainfall. KICA Security remained on the island throughout the storm and reported that the worst conditions ensued around 1:30 a.m. At 1:45 a.m., Security supervisors pulled patrol due to safety concerns as the National Weather Service issued a tornado warning, and a severe band of thunderstorms approached the eastern end of Kiawah Island, moving north at 45 mph. Simultaneously, wind speeds began to climb at all local weather stations. Shortly after the tornado warning was rescinded at 2:46 a.m., Security reported the first fallen tree at Kiawah Island Parkway and Sanctuary Beach Drive.
During the tornado warning, the Kiawah River Bridge tide gauge recorded rising water levels. Low tide was originally predicted to be 0.5 ft. at 1:50 AM, but winds from the storm never allowed water levels to fall below 2.11 ft. at the bridge. The peak water level during the morning of July 8 was 3.53 ft., which equated to 1.42 ft. of storm surge. This short-lived surge fell about thirty minutes later, then climbed again at 3:15 a.m. following an additional band of rain and increase in wind speed. Thirty minutes after this second climb, water levels in the Kiawah River began to normalize, and by 7:48 AM water levels in the Kiawah River started to fall below predicted values.
Digging Deeper into the Storm Data
Figure 1 is an export from the Kiawah River Bridge Tide Gauge with all water levels referenced to the mean lower low water (MLLW) tidal datum. In this graph, you will see two arrows. The first arrow is pointing to the initial storm surge that was recorded at 2:00 a.m. This was 20 minutes after the large band of thunderstorms approached the island (see image below) and the National Weather Service issued their Tornado Warning. The first, and largest, storm surge peaked at 1.42 ft. above the astronomical tide and 3 ft. above the predicted tide for the day. Storm surge is calculated by subtracting what the water level would have been in absence of the storm from the measured water level. In our case, the lowest tide during the storm was 2.11 ft., which climbed to 3.53 ft. at its peak. The second arrow highlights the smaller surge (0.8 ft.) that was observed later in the day following a second band of rain moving over the island. The highest water level recorded throughout the event was 5.23 ft. at 6:15 a.m., which was during the transition into high tide.

Figure 1: Tide chart from Kiawah River Bridge tide gauge.
Figure 2 shows the major band of thunderstorms that passed over the eastern end of the island around 1:40-2 a.m. when the National Weather Service issued the tornado warning for our area. The rain and wind from this band likely caused the storm surges recorded in the graph above and are reflected in the following wind speed map (Figure 4).
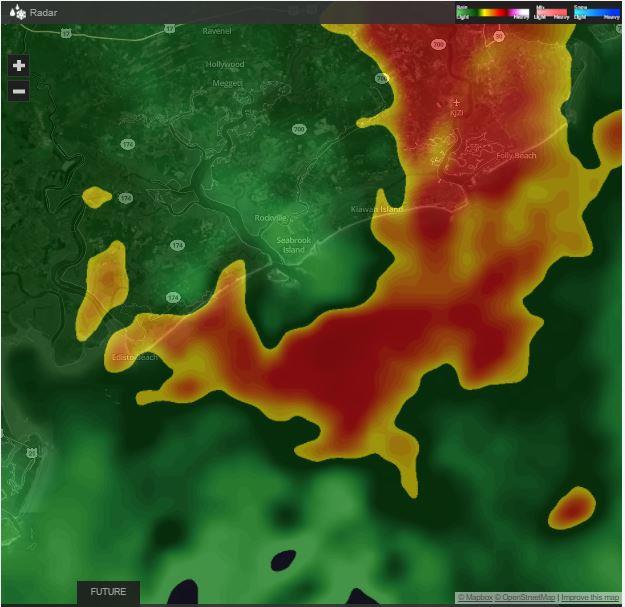
Figure 2: Screen capture of weather radar from the National Weather Service at 1:40 AM.
Figure 3 shows extrapolated rainfall amounts for the island based on the rainfall totals at eight on-island weather stations (red pins) and two off-island weather stations (not pictured). The map includes a scale that shifts from light blue to pink as rainfall totals become greater. It should be noted that the Timbers weather station (bottom left pin) went down at 2:47 a.m. and failed to record the remaining rainfall amounts and wind speeds near the end of the storm; however, all remaining stations continued to operate normally. This image shows that the majority of rainfall (3.8 to 4.4 in.) fell on the western end of the island closest to the KICA Water Management pond 30 project (star).

Figure 3: Tropical Storm Elsa total rainfall map.
The map below (Figure 4) shows extrapolated wind speeds for the island based on speeds recorded at eight on-island weather stations (red pins) and two off-island weather stations (not pictured). Again, note that the Timbers weather station (bottom left pin) went down at 2:47 a.m. and failed to record the remaining rainfall amounts and wind speeds near the end of the storm. When comparing the map above to Figure 4, there seems to be an inverse relationship between areas with higher wind speeds and those with more rainfall. This could be an illustration of how winds were pulling bands of rain over the island, higher wind speeds skewing rainfall measurements or sampling error attributed to the site conditions at weather stations on the eastern end of the island. These high wind speeds were a major driver in the discrepancy between observed and predicted water levels and more than likely influenced rainfall readings at local weather stations.
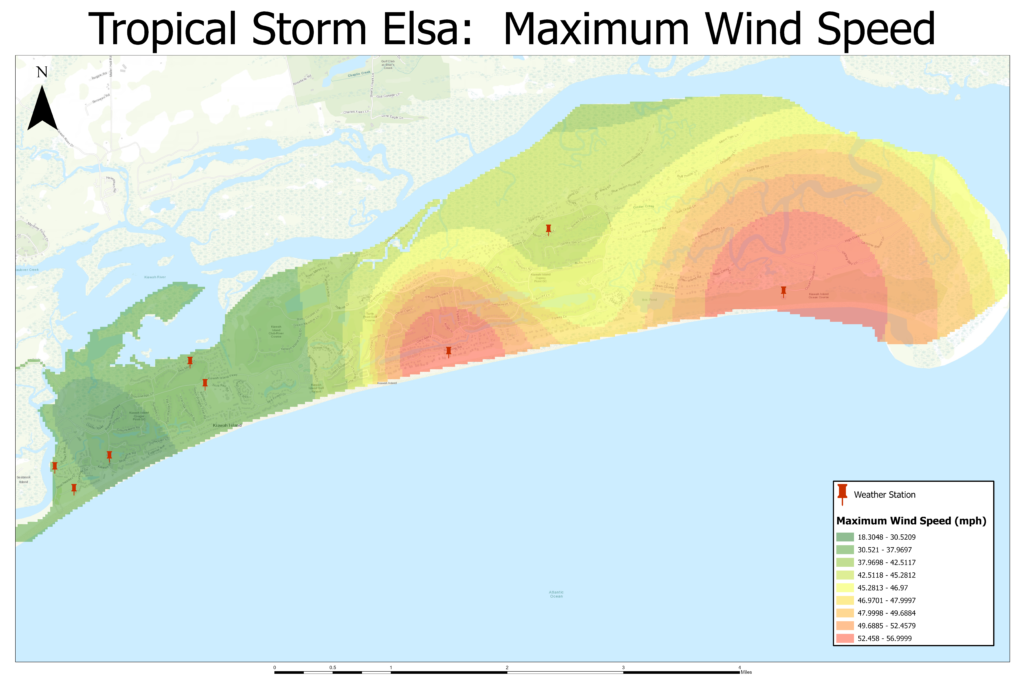
Figure 4: Tropical Storm Elsa maximum wind speeds.
After the Storm
Following the storm, approximately a dozen fallen trees were identified across the island, the majority at the center of the island before the Vanderhorst Gate. There was also a significant amount of debris collected on all major thoroughfares and many smaller streets around the island. Berkeley Electric reported 201 customers were without power at 7:41 a.m. The locations of outages were in Turtle Cove and neighborhoods around Green Dolphin Way.
Overall, little to no flooding was observed on the island due to rainfall, storm surge or a combination of the two despite the island receiving somewhere between 2.2 and 4.4 inches of rain. Due to the amount of rain received in such a short period of time (approx. 5 hrs.), owners in the Settlement and near Trumpet Creeper were contacted to determine the efficacy of the first two Water Management Task Force Projects. Both areas remained clear throughout the entirety of the storm.
Water levels in the Kiawah River continued to stabilize from their earlier spike. By 7:48 a.m. July 8, tides fell below predicted values. At 10 a.m., tides remained well below predicted values, indicating a rapid discharge of water from the island and Kiawah River.
The intersection of Turtle Point Lane and Tennis Club Lane experienced flooding, though the road was passable. It was determined to be pipes clogged by debris, which was resolved the next morning by clearing the drainage lines.
Tropical Storm Elsa Summary
In reference to the pond 30 project location in Figure 3, the 3 to 4.4 inches of rainfall projected for the area is equivalent to a 2-year 24-hour rainfall event despite occurring within a matter of only four to five hours. Furthermore, the modeled 2-year 24-hour rainfall event predicted flooding in the immediate areas of the Kiawah Island Parkway, the Settlement and Salt Meadow Cove. This outfall was created in order to relieve pressure from the Beachwalker drainage basin that spans from the Vanderhorst Gate to Beachwalker Drive (see Figure 5).
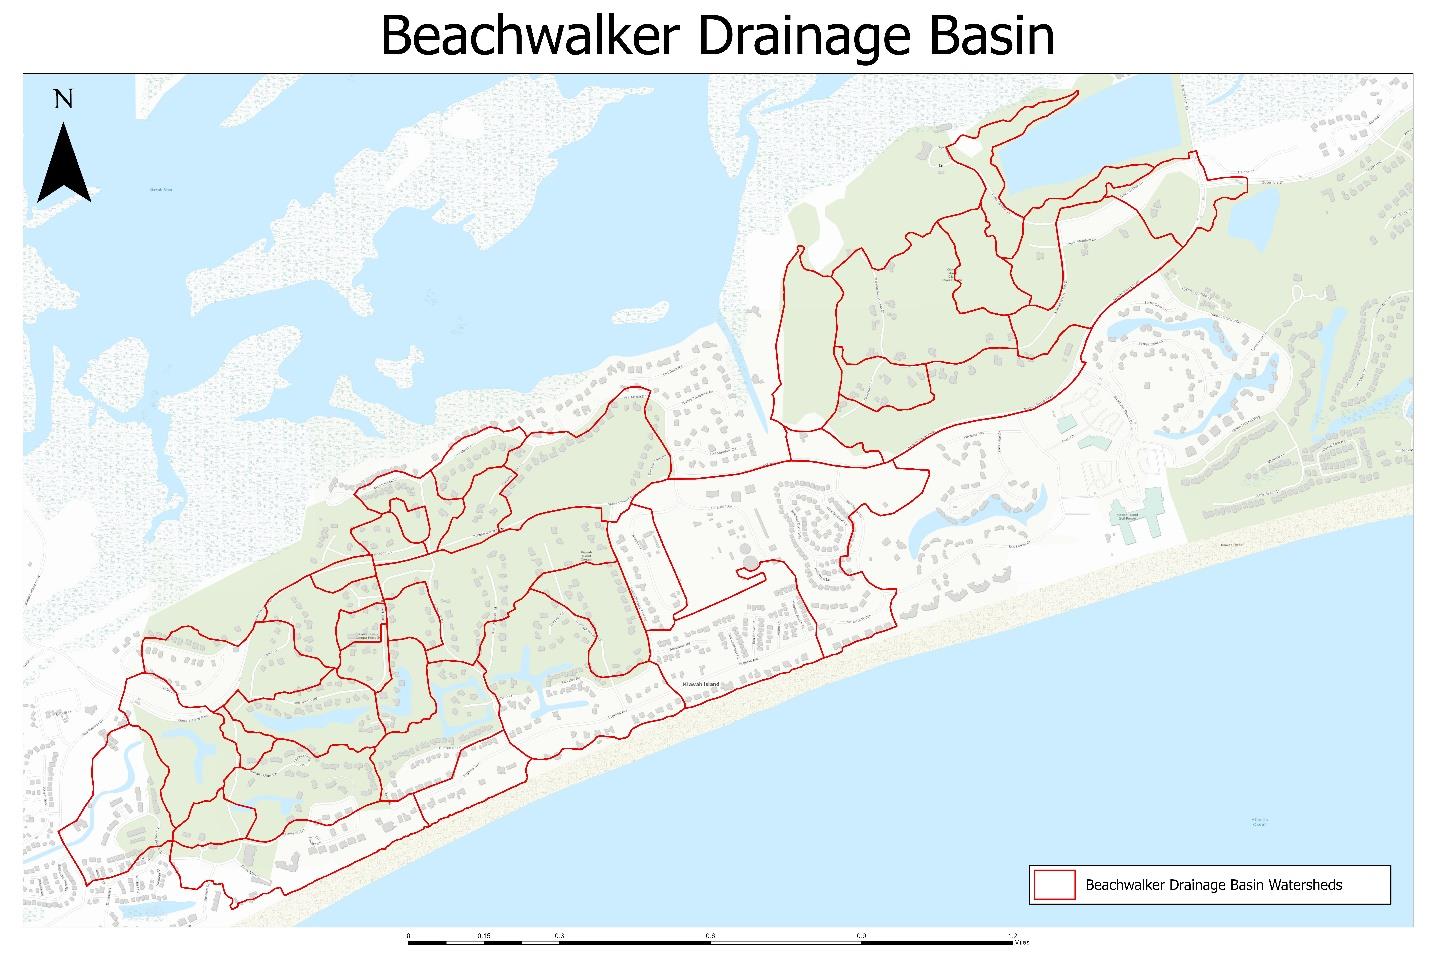
Figure 5: All watersheds within the Beachwalker drainage basin.
Both KICA and STANTEC models indicated that there was a bottleneck between pond 29 and pond 30. Rather than removing the connection between ponds, a new outfall was constructed at the tidal inlet near Sora Rail Road to provide for an additional outlet when the Beachwalker system is overtaxed. The system is also equipped with flap gates to prevent tidal backflow during king tide events.
The Trumpet Creeper Lane project (Figure 6) is underway but has recently been dredged and many of the older pipes have either been cleaned and/or repaired. The dredging was done to clear the inlet of sediments that have collected and blocked outflow pipes connected to the inlet near Governors Drive, Sweet Grass Lane and Marsh Edge Lane. This system collects water from Trumpet Creeper Lane, Sweet Grass Lane, the immediate area of Governors Drive and most of Marsh Edge Lane and will also incorporate a similar system to mitigate tidal backflow from entering the pond system in the future.
During the event, both new project areas were monitored by staff and KICA has received no reports of flooding in these areas. Though this is the first tropical storm to test our new projects, we feel this initially speaks to the efficacy of our water management efforts.
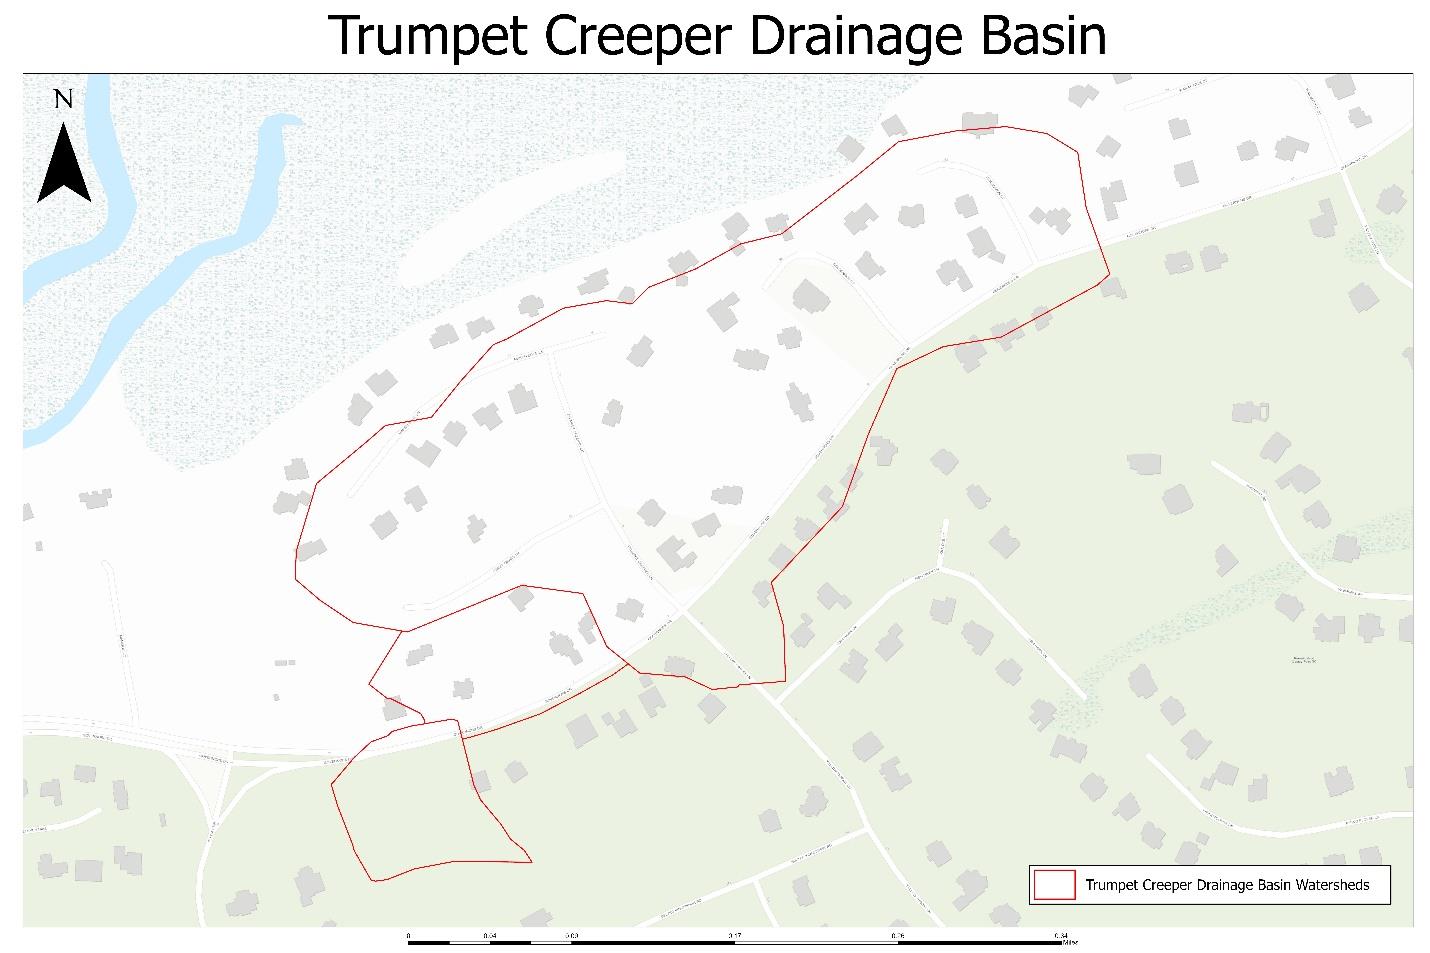
Figure 6: All watersheds within the Trumpet Creeper drainage basin.
After recording post-storm water levels, all measured ponds had an increase of 5 inches due to runoff. This brought our pond levels back to normal conditions after they were below normal 4- 6 inches prior to the storm. In all, the island fared well throughout Tropical Storm Elsa in regard to flooding. There were downed trees and plenty of debris to remove, but flooding was minimal due to the storm arriving during a low tide cycle and the capacity of our stormwater system.